1 Introduction
Data and their analysis play a crucial role in research and science. In recent years, especially with steadily increasing computational power and the advances in Artificial Intelligence (AI), the importance of high-quality data has continued to grow. In this context, entire research fields and committees exclusively focus on improving data and their quality to maximize the potential of their use. However, using AI in the industry also offers enormous benefits for companies. In typical condition monitoring tasks, for example, early detection of damages or wear down of machine parts can avoid unplanned machine downtime costs. Instead, maintenance can then be scheduled, and downtimes can thus be minimized. Especially small and medium-sized enterprises (SMEs) often have no dedicated department, skilled staff, or resources for analyzing their data and performing machine learning (ML) [1]. For these cases and to retain the obtained knowledge, the concept “PIA – Personal Information Assistant for Data Analysis” has been developed. PIA is an open-source framework based on Angular 13.3.4, a platform for building mobile and desktop web applications, which runs locally on a server and can be accessed via the intranet. PIA is developed following the in research widely accepted FAIR (Findable, Accessible, Interoperable, and Reusable) data principles and aims to transfer and apply these principles in the industry as well [2].
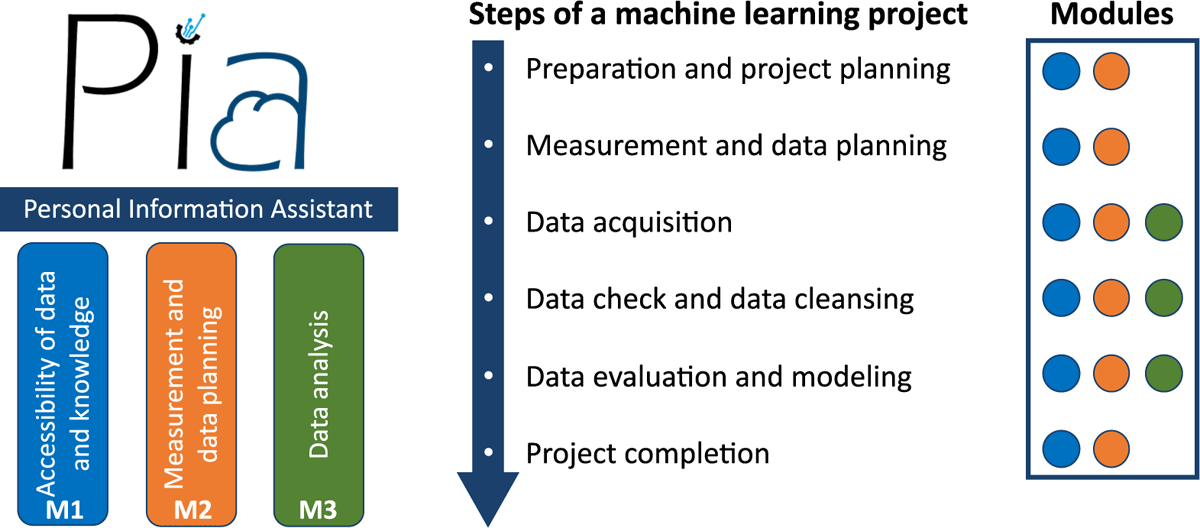
The concept for PIA consists of three complementing modules that support users in different stages of the machine learning project:
Module M1: Accessibility of data and knowledge
Module M2: Measurement and data planning
Module M3: Data analysis
Figure 1 shows the three modules (M1-M3) as pillars of PIA. Furthermore, the steps of a machine learning project are shown with the involved modules in their respective color. It can be seen that M1 and M2 cover all steps of a machine learning project and are therefore closely connected to each other in the concept of PIA.
In M1 (Accessibility of data and knowledge), PIA provides an easy interface to access knowledge and data through the intranet. Here, two well-established methods in project management for lessons learned were combined and implemented as a knowledge base into PIA. Furthermore, an intuitive user interface (UI) enables users to easily find and access relevant (meta)data. In M2 (Measurement and data planning), PIA provides a checklist that was developed by Schnur et al. [3], [4] in a previous project on brownfield assembly lines to increase data quality. An English checklist version can be found in [5]. M3 (Data analysis) is based on the automated ML toolbox of Dorst et al. [6] and Schneider et al. [7], [8], which was developed in previous projects and successfully applied to industrial time-continuous data.
To the authors’ knowledge, the concept PIA is a novel concept that covers a holistic approach to enable inexperienced industrial users to perform a first data analysis project, focusing on the domain of measurement and data planning. Here, the three modules are combined in a complementing manner and brought into an interface that assists users in data analysis and ensures the recordings of high-quality and "FAIR" data. Furthermore, a demonstrator for the concept has been developed as a front-end in Angular 13.3.4 and tested on an assembly line as a use case, which assembles a specific product in several variants, focusing on bolting processes.
The structure of the paper is as follows: In the next chapter, the theoretical background and methodology will be explained, starting by pointing out the flaws of data in the industry, followed by the three modules M1-M3. In the chapter Implementation and Results, the use case Assembly Line is introduced, and details about the environment and structure of PIA are given. Thereafter, the implementation and application of the concept to each module is shown. The chapter Conclusion and Outlook summarizes the presented concept and what future research of PIA will cover.
2 Theoretical Background and Methodology
In the chapter Theoretical Background and Methodology first, data in an industrial context and its common problems will be elaborated on. Thereafter, each of the three modules (M1-M3) with their respective methods will be explained.
2.1 Data in Industry
In their empirical study, Bauer et al. [1] found that the lack of sufficient employees (with ML knowledge) and limited budget are part of the most frequent significant challenges for SMEs. This can lead to rushed approaches, which end in a database with low-quality data. However, an essential requirement for a successful application of AI in the industrial context is a database with high-quality data, e.g., from production and testing processes. The practical application of AI algorithms often fails due to
Insufficient data quality due to missing or incomplete data annotation
Incomplete data acquisition
Problems linking measurement data to the corresponding manufactured products
Lack of synchronization between different data acquisition systems
as shown in [9]. Furthermore, industrial data are typically acquired continuously without saving relevant metadata. In addition, this often leads to a brute force approach, which tries to use all acquired data. Large data sets are subsequently challenging to manage, and their use is computationally expensive. A knowledge-driven approach can efficiently use resources and increase the information density within the data, e.g., by reducing the amount of used sensor data due to process knowledge. By recording data in a targeted manner, redundancies can also be avoided. The necessary process knowledge to analyze data, especially in SMEs, is often limited to a few employees and cannot be easily accessed by colleagues. Those specialists might also not be willing to share their knowledge in fear they lose their distinctiveness against other employees [10]. In the worst case, the (process) knowledge is lost if the specialist leaves the company.
2.2 Module 1 – Accessibility of Data and Knowledge
Due to the specific challenges in the analysis of industrial data mentioned by Wilhelm et al. [9], the accessibility of the data itself and the accessibility of domain-specific knowledge play a crucial role in obtaining robust ML models or further insights and knowledge about, e.g., products or processes. Module 1 of PIA, therefore, consists of a UI to access easily (meta)data and knowledge as well as a knowledge base in the form of a lessons learned register. M1 can be seen as a complementing add-on component to internal knowledge repositories like company wikis [11] and databases like InfluxDB [12] or MongoDB [13]. Guidance on recording and structuring data and metadata can be found in the checklist [4] presented in chapter 2.3 as well.
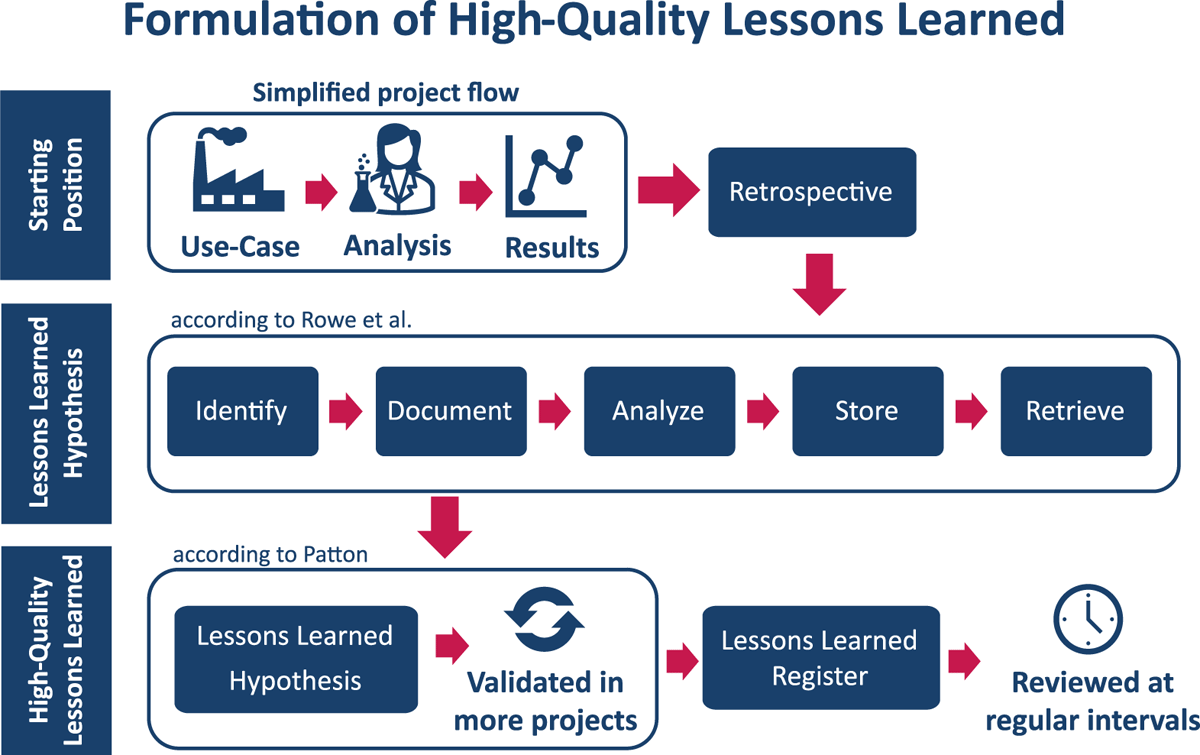
To learn from previous projects and retrieve knowledge to use in future projects, lessons learned are a well-established method in project management [14]. In the context of the framework PIA, the lessons learned register is organized and structured like the checklist presented in M2 and contains high-quality lessons learned for each specific chapter of the checklist. Rowe et al. [14] structure the formulation of lessons learned into the five subsequent steps: identify, document, analyze, store, and retrieve. Moreover, they describe these steps in more detail and provide a template for lessons learned. The technical standard DOE-STD-7501-99 [15] suggests that each lesson learned should contain the following five elements:
Understandable explanation of the lesson
Context on how the lesson was learned
Advantages of applying the lesson and potential future applications
Contact information for further information
Key data fields increase the findability
Additionally, Patton [16] distinguishes lessons learned into lessons learned hypothesis and high-quality lessons learned. While a lessons learned hypothesis is a lesson learned with one supporting evidence, high-quality lessons learned could be approved in multiple projects. To ensure the quality of the lessons learned, Patton [16] further formulated ten questions in his paper for generating such high-quality lessons learned. Moreover, he recommended reviewing lessons learned periodically regarding their usefulness and sorting out obsolete lessons learned to maintain high quality.
Figure 2 shows the approach proposed in this contribution. After analyzing a given use case, specific results were achieved. The whole project is evaluated in a retrospective, and lessons learned are formulated according to the five steps of Rowe et al. [14]. If the lessons learned (hypothesis) can be validated in further projects, they get added to the lessons learned register. The lessons learned register is reviewed regularly to ensure relevance and actuality.
2.3 Module 2 – Checklist for Measurement and Data Planning
The foundation for successfully applying AI in industry is a high quality of the underlying data. The research field measurement and data planning can be seen as an early part or requirement of data mining, which is the process of extracting knowledge from data sets using computational techniques [17]. For industrial data mining, the Cross-Industry Standard Process for Data Mining (CRISP-DM) established, which divides data mining into the six non-sequential and independent phases: business understanding, data understanding, data preparation, modeling, evaluation, and deployment [18]. Since data mining consists of several disciplines, each of which has its own research area, inexperienced users can feel overwhelmed and demotivated mainly because the industry’s focus is not to record high-quality data but to use data to increase efficiency and margin. A guide or checklist can help users to orientate and access the field of data mining. Here several approaches can be found in literature like, e.g., A Checklist for Analyzing Data of [19] or the Analytical Checklist – A Data Scientist’ Guide for Data Analysis [20]. The checklists mentioned are universally applicable but lack information for the realization of a data analysis project and assume that data sets are already recorded. Other concepts, like, e.g., FAIR of Wilkinson et al. [2] ensure high-quality data and offer practicable solutions like The FAIR Cookbook that guide new users but are primarily focused on research data.
The Checklist - Measurement and data planning for machine learning in assembly of Schnur et al. [3] tries to find the sweet spot between having a broad scope, transferring knowledge from research data management but still being clearly structured and not overwhelming for an inexperienced user. Within PIA, the checklist enables the users of PIA to perform a machine learning project from the beginning to the end and record high-quality FAIR data. It covers the following chapters:
Preparation and project planning
Measurement and data planning
Data acquisition
Data check and data cleansing
Data evaluation and modeling
Project completion
Each chapter begins with a short introduction, followed by checkpoints that guide the user. Here, two types of checkpoints exist: necessary and best-practice checkpoints. While the best-practice checkpoints are optional but highly recommended, the necessary checkpoints must be executed. Furthermore, the checklists provide tips and notes derived from high-quality lessons learned from previous ML projects and further literature suggestions. The checklist is based on a revised version of the CRISP-DM mentioned above. Therefore, some parts of the checklist are iterative.
The checklist was initially published in German on the file-sharing platform Zenodo and has been translated for integration into PIA to English, which also increases accessibility and re-usability [4].
2.4 Module 3 – Data Analysis
In nowadays industry, an extensive range of tools and software for data analysis exists. Some well-known and established examples are the software library Pandas for Python [21], Power BI [22], the Statistics and Machine Learning Toolbox of MATLAB ® [23] or the open platform KNIME [24]. All the solutions mentioned are powerful data analysis tools and offer a broad spectrum of algorithms.
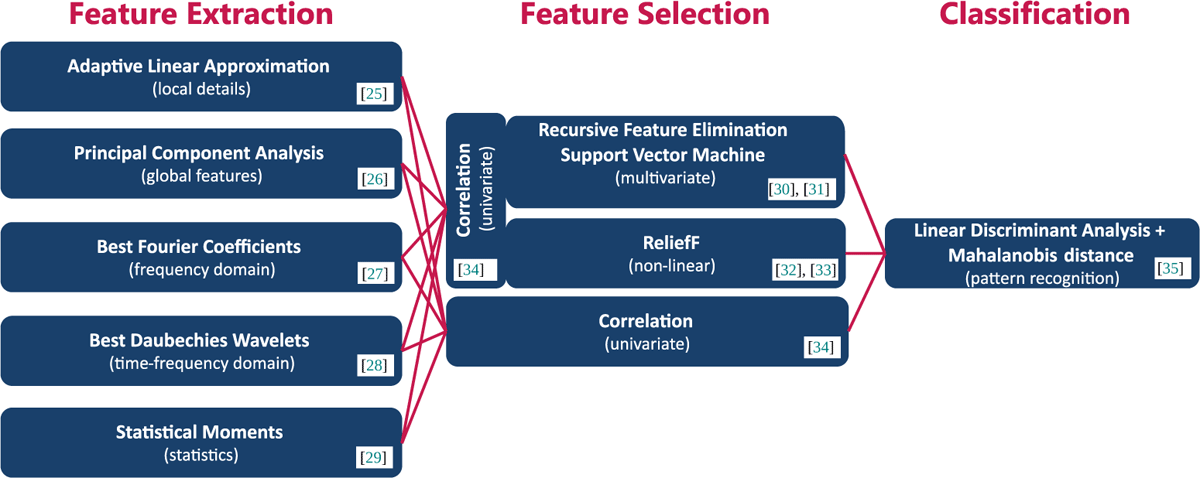
Within the concept of PIA, the focus lies on time-continuous data. However, potential users can implement every ML tool or algorithm that suits their use case and data into M3, starting from traditional approaches like feature extraction, selection, and classification/regression to modern approaches like deep learning with neural networks. However, it could be shown by Goodarzi et al. [36] that traditional approaches could perform similar to modern approaches while being less complex and have a higher interpretability. To cope with the heterogeneous data sources in industrial applications, especially as an inexperienced user, a set of different feature extraction and selection methods can be beneficial [37]. For the implementation of PIA within this study, the authors use the existing automated ML toolbox for time-continuous data of Dorst et al. [6] and Schneider et al. [7]. This toolbox automatically tests different combinations of feature extraction and feature selection methods with linear discriminant analysis and Mahalanobis distance as the classifier. This automated ML toolbox combines five complementary feature extraction methods with three feature selection methods, as shown with their corresponding literature in Figure 3. A 10-fold cross-validation automatically determines the best of the resulting 15 combinations by ranking the combinations according to their resulting cross-validation error on the test data [38], [39]. Due to the different focus of each algorithm (shown in Figure 3), the toolbox could achieve good results in a broad application range ([37], [40]).
Algorithms of the automated ML toolbox for classification with their corresponding literature (adapted from [6]).
Users can perform a first ML analysis with the toolbox by running five lines of code:
1 addPaths; %Adds folders and subfolders to the path
2 load dataset.mat %Load data set
3 fulltoolbox = Factory.FullToolboxMultisens(); %Build object
4 fulltoolbox.train(data,target); %Train model with data and target as input
5 prediction = fulltoolbox.apply(data); %Apply trained model on data
Listing 1: Code to run the complete toolbox.
For further analysis or regression tasks, the methods can be modified, changed, or applied separately.
3 Implementation and Results
To evaluate the methods presented in the chapter Theoretical Background and Methodology, the use case Assembly Line will be first introduced in this chapter. After that, PIA’s chosen environment and structure will be shown, followed by the implementation of the three modules regarding the given use case.
3.1 Use Case: Assembly Line
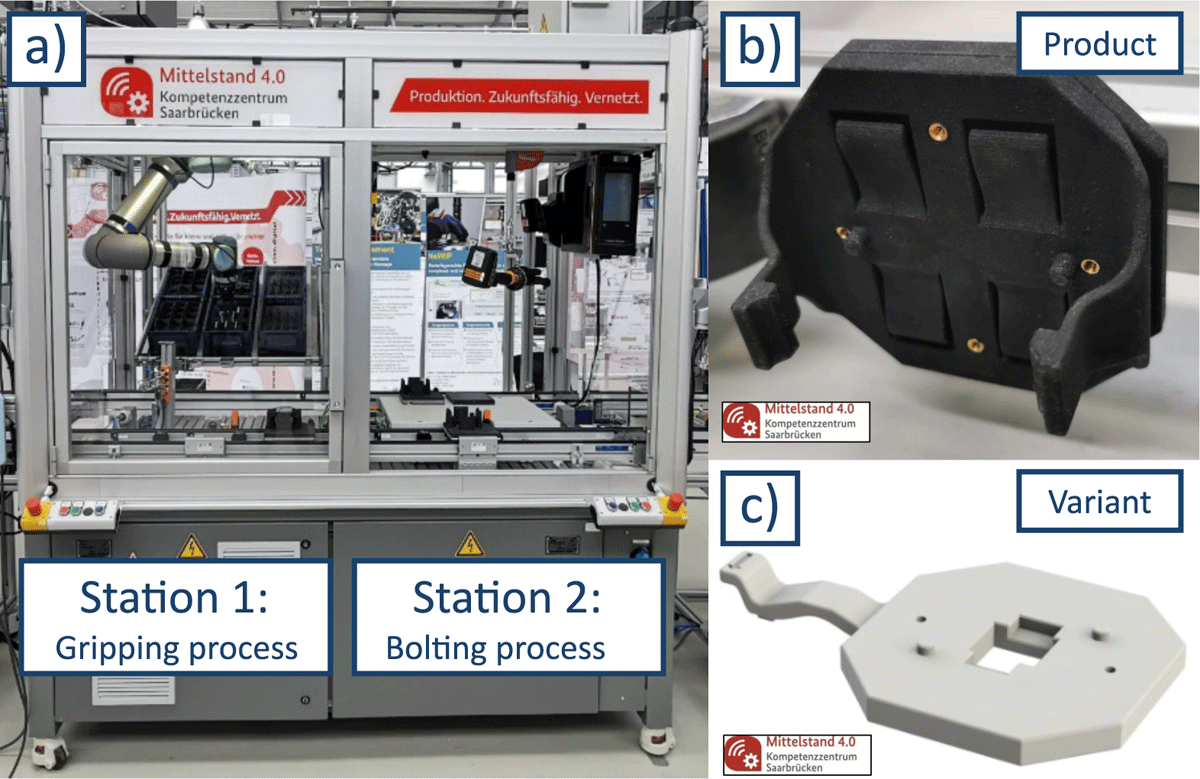
As a validation use case for this contribution, an assembly line with two stations was chosen (Figure 4a) that produces a device holder (Figure 4b). In the first station, a robot picks up the individual parts of the device holder from a warehouse and places them on a workpiece carrier. The product is transported to station 2 by a belt conveyor for the next step. There, a worker assembles the two components by a bolting process. In addition, the device holder can be produced in another variant (Figure 4c). The use case is presented in more detail in [41].
The combination of two different stations with different processes and different degrees of automation, as well as the opportunity to produce a second variant of the device holder, make this assembly line a good use case for demonstrating the flexibility of PIA while keeping the complexity low (compared to more extensive assembly lines).
3.2 Environment and Structure of PIA
The Angular framework, an open-source single-page web application framework, has been chosen to demonstrate the concept of PIA. Angular 13.3.4. allows fast development of the demonstrator and gives the possibility that, once the demonstrator is hosted on the web, PIA can be easily accessed from any device within the intranet.
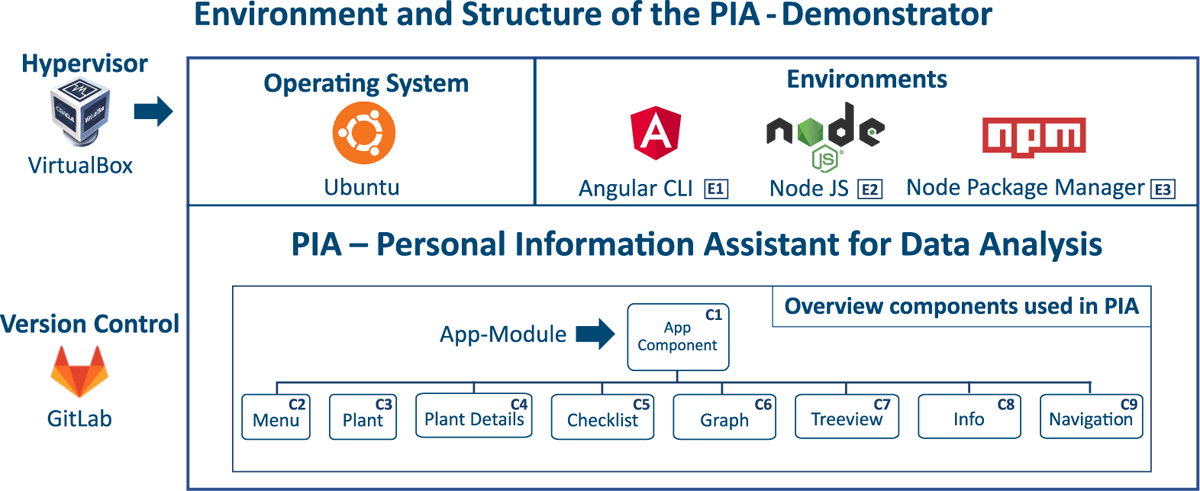
Figure 5 shows a schematic representation of the development environment of PIA. For simulating the user experience, the type-2 hypervisor Oracle VM VirtualBox (https://www.virtualbox.org/) from Oracle Corporation was used with Ubuntu as the guest operating system (OS). However, in general, Angular can also be used on Microsoft Windows or Apple macOS.
Table 1 gives an overview of the used environments and Table 2 of the used libraries, each with their corresponding sources.
Overview of the used environments.
| Value | Package | Source |
| E1 | Angular CLI | https://www.angular.io/ |
| E2 | Node JS | https://www.nodejs.org/en/ |
| E3 | Node Package Manager | https://www.npmjs.com/ |
Overview of the used libraries.
| Value | Package | Source |
| L1 | Angular Forms | https://www.npmjs.com/package/@angular/forms |
| L2 | Angular Material | https://www.material.angular.io/ |
| L3 | Bootstrap | https://www.npmjs.com/package/bootstrap |
| L4 | Charts js | https://www.npmjs.com/package/chart.js |
| L5 | Flex Layout | https://www.npmjs.com/package/flex-layout |
Besides Angular (E1), the environments Node JS (E2) and Node Package Manager (E3) are used. Angular’s primary architectural features are a hierarchy of components. Using this structure, the various PIA functionalities have been separated into components for ease of use and reuse. Table 3 provides an overview with a short description of the components used in PIA. This structure also allows to easily add new components to the application without interfering with existing ones. The Angular Material library (L2) provides a consistent experience across the website. Specific dynamic components have also been made responsive using Bootstrap and Flex-Layout libraries (L3, L4). To make it easier for future developers to add new information to the website, data about each process has been saved in JSON format and then queried to display the relevant information in the UI. Users or developers can easily add more plants or tools to the application by editing the relevant JSON file, which will be dynamically displayed in the UI.
Overview of the used components.
| Nr | Component Name | Description |
| C1 | App Component | The application’s root component is defined in the app.module.ts file and bootstrapped to the main.ts file to start the application. It acts as a container for all other components in the application. |
| C2 | Menu | It provides a menu in the application to navigate through the various features. It appears on the left-hand side of the UI and has buttons for navigation through components. |
| C3 | Plant | Implements the navigation to select the specific plant described in the application and provides buttons to navigate through the various embedded components. |
| C4 | Plant Details | Implements the information about a specific plant and contains an array of objects, which saves information about the specific plant. Each object in the array contains properties that describe the plant. The main array of the plant has further arrays embedded inside, with similar properties describing the processes/stations inside a plant. |
| C5 | Checklist | Implements the checklist with a navigation pane to move to different nodes inside the checklist. It has a JSON implementation that contains the description and other relevant information about each node in the checklist. |
| C6 | Graph | Implements the plotting of graphs in the application with the Charts js library. It allows users to plot data from an uploaded CSV-file. |
| C7 | Treeview | Implements the tree view of available or used processes. Furthermore, it implements the domain-specific knowledge of those processes or related tools in so-called cards. |
| C8 | Info | Implements a card that displays specific text information regarding a particular process in the plant. |
| C9 | Navigation | Header component, which implements the logo and name of the application |
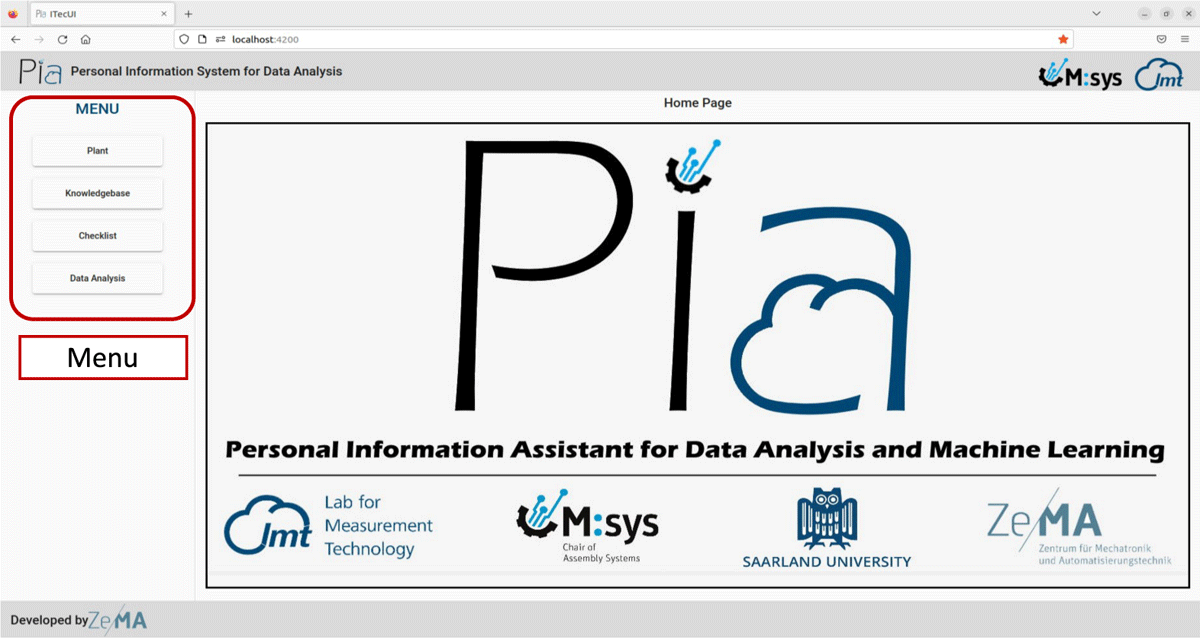
Figure 6 shows the landing page of PIA. Over a menu, the user can navigate through the four menu points:
Plant
Knowledge base
Checklist
Data Analysis
3.3 Module 1 – Accessibility of Data and Knowledge
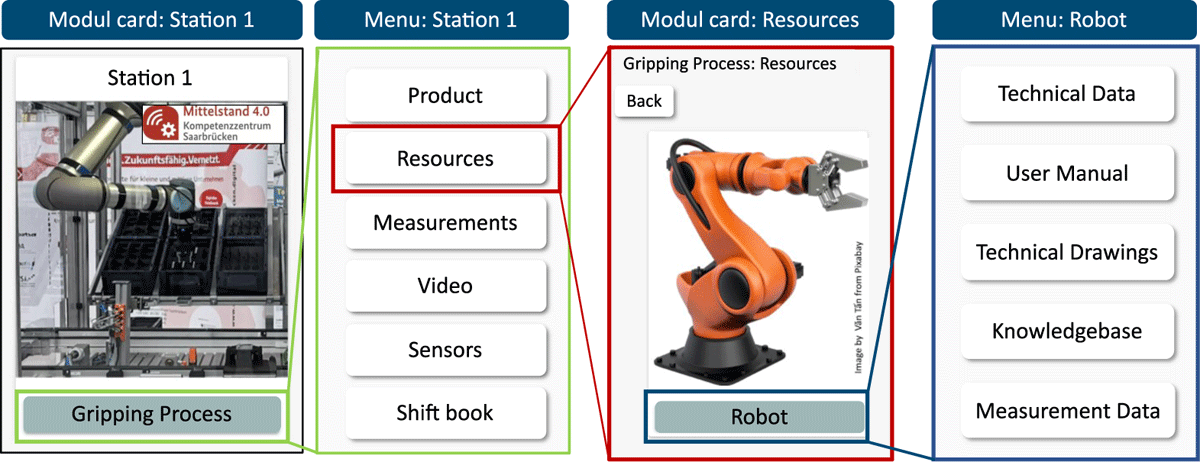
The implementation of M1 contains two parts, accessibility of data and metadata (menu-point: Plant) and a lessons learned register (Knowledge base). The plant module displays information, data, and metadata about various plants. Figure 7 shows an example flow-through of the use case in this study. After clicking on the Plant button, the available stations of the plant are displayed: Gripping Process and Bolting Process. After selecting a process (Figure 7, green box), the user can select between the following options:
Product: Displays all available products with their variants containing further information like CAD files and technical drawings.
Resources: All process resources are displayed with a picture (Figure 7, red box) and contain sub menus (Figure 7, blue box) with further information.
Measurements: Data can be loaded as a CSV-file into PIA and plotted through the charts.js (L4) library.
Video: A video of the process that shows the procedure and allows the user to develop a better understanding and link the data of a process. The video was embedded using the HTML iframe tag.
Sensors: Contains an overview of all used sensors and their metadata (like sensor type, sensor position, sampling rate, etc.).
Shift book: Displays the digital version of the shift book. Using the entries of the shift book can support the user, e.g., to explain outliers or shifts in data.
All information is contained in an array of JavaScript objects. Therefore, a new plant, station, or resource can be easily included by adding new objects to the array in the same format and assigning it on the front-end. Here, Angular material cards (L2) are used to display further information, e.g., process resources. An example of the basic structure of the array of objects for a Station with one process which includes a robot and relevant metadata, e.g., technical data or technical drawings, is shown in list. 2 (Section A).
Further instances of the resources, e.g., a gripper for the robot, can be easily added by creating a new object with ID, name, and paths corresponding to the documents and images in the assets folder and providing the relative paths to the corresponding documents. The new instance will automatically be displayed in the UI after recompiling. Furthermore, the button Knowledge base (Figure 7, blue box) contains specific knowledge about each resource.
The second part of the knowledge base contains the lessons learned register and a simple example of the link to general knowledge. The general knowledge was implemented illustratively as a graphical representation of the assembly processes in the form of a tree. Here, the user can expand the tree by selecting the respective nodes to access the sub-nodes that describe the next steps of the process described in the parent node. The information component has been integrated with the nodes, which can provide further descriptive information about each node.
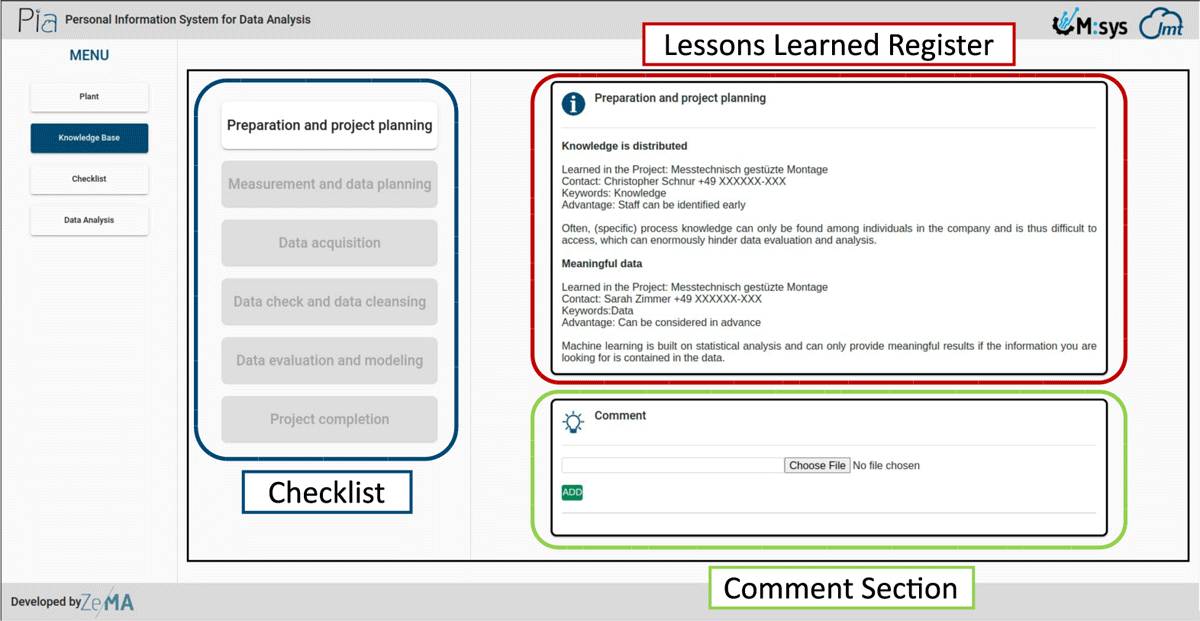
The implementation of the lessons learned register is shown in Figure 8. In the suggested version of a lessons learned register, each lesson learned is generated by the process shown in Figure 2 and grouped by their respective project step (chapter) of the checklist (Figure 8, blue box). After selecting a chapter, the lessons learned appear on the right-hand side (Figure 8, red box). Users can add criticism to existing lessons learned, lessons learned hypotheses, or additional files in the Comment Section (Figure 8, green box). The Comment Section is reviewed at regular intervals and, if necessary, transferred to the Lessons Learned Register.
Using the presented structured, high-quality lessons learned register allows the user to easily access domain-specific knowledge in a target-orientated manner and to avoid previously made mistakes in earlier projects. The presented GUI enables users to find relevant information intuitively rather than searching for information in multi-layered folder structures with restricted accessibility.
3.4 Module 2 – Checklist for Measurement and Data Planning
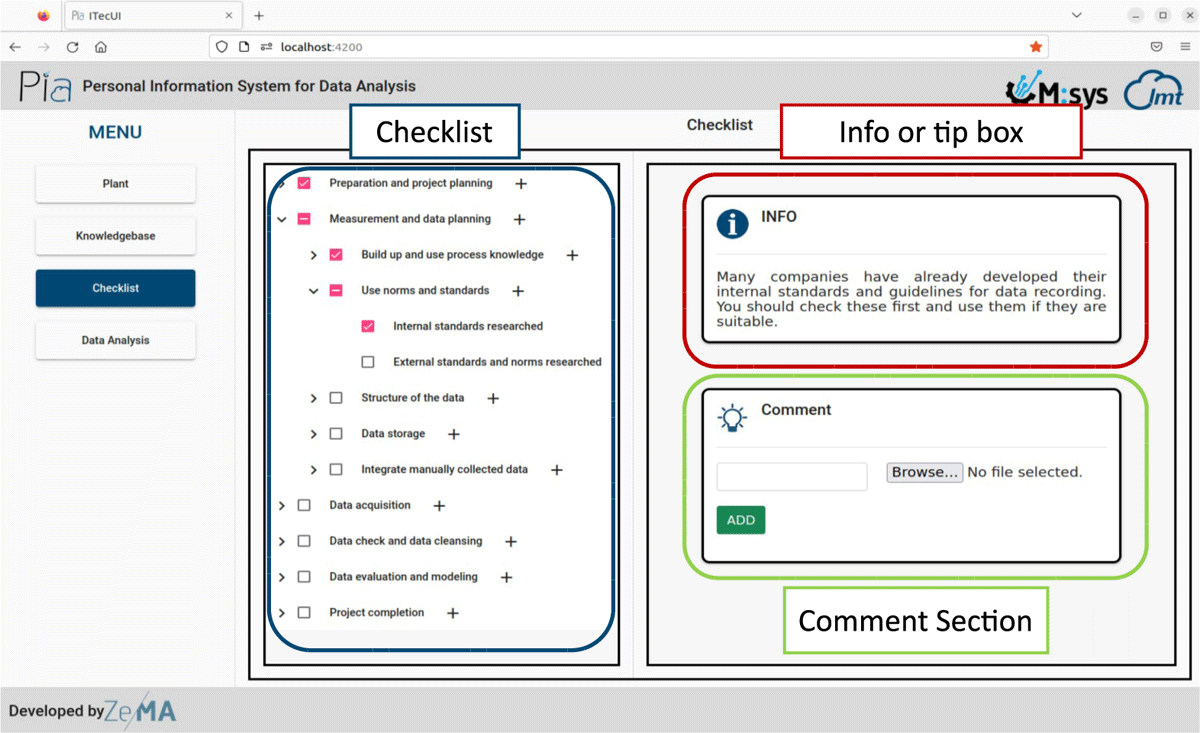
The checklist implementation uses the tree component of the Angular Material (L2) library, which allows the present hierarchical content as an expandable tree (Figure 9, blue box). Each node of this tree displays information about itself and additional tips or hints (Figure 9, red box). Furthermore, comments and files can be added to each checkpoint (Figure 9, green box). This helps employees who are new to the project to catch up and comprehend past steps. When the user ticks through all the sub-nodes, the primary process node is automatically ticked, indicating that all the sub-processes have been completed.
The Checklist for Measurement and Data Planning guides and supports users holistically through a data analysis project while highlighting trip points. Using the checklist in an implemented version rather than the printed version, the status and progress of ongoing projects can be tracked and understood by non-involved users in case a worker gets sick or leaves the company.
3.5 Module 3 – Data Analysis
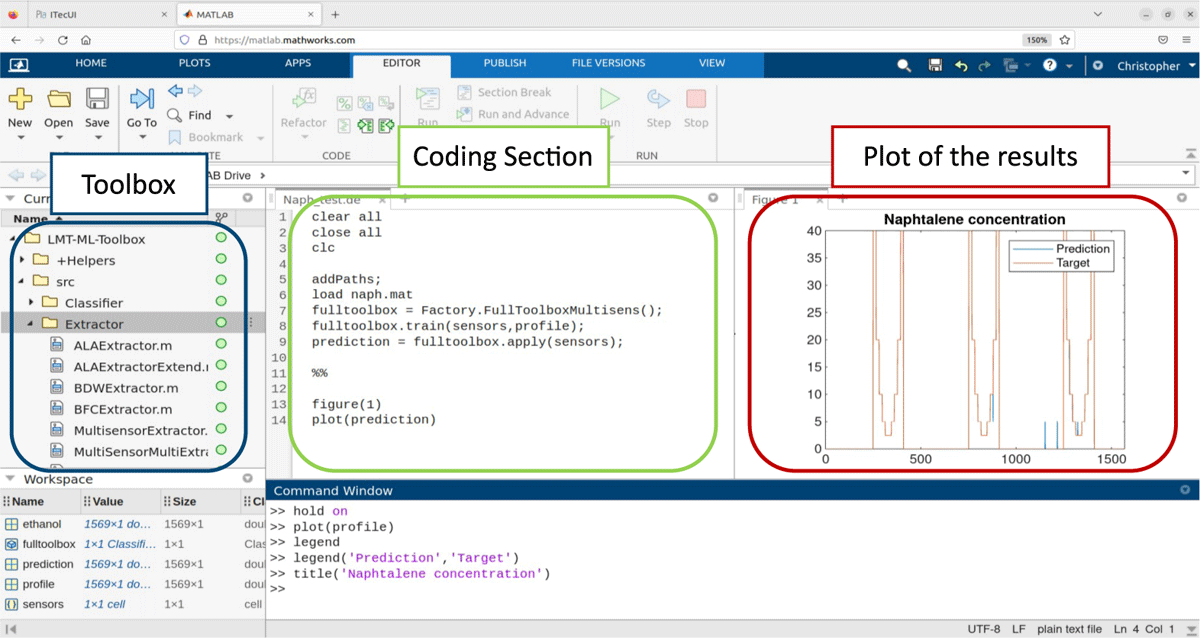
Since PIA is implemented as a front-end demonstrator with no back-end, the data analysis is carried out in MATLAB® Online™. Figure 10 shows the results of the data analysis with the ML toolbox for data of the example use case provided in [6]. The toolbox can be directly connected to GitHub into MATLAB® Online™ (Figure 10). As shown in the blue box of Figure 10, the user can access other algorithms by clicking through the folder structure. After executing the code (Figure 10, green box), the user can plot the results (Figure 10, red box). For interpreting the results, the user can follow the subsequent steps of the checklist in M2 while using the knowledge, data, and metadata provided in M1.
The implemented toolbox can be used by users with little programming experience while covering a broad range of algorithms for analyzing industrial time-continuous data with ML. However, the users can also embed other, e.g., use-case-specific algorithms.
4 Conclusion and Outlook
The personal information assistant PIA supports inexperienced users in performing an ML project and gaining further insights from data. For this, it consists of the three modules Accessibility of Data and Knowledge, Checklist for Measurement and Data Planning, and Data Analysis. Accessibility of Data and Knowledge allows the user to access relevant metadata and gain knowledge about the plant and processes through a lessons learned register. Using the concept, data, and metadata can be recorded and organized in a targeted and structured manner, creating appropriate boundary conditions for data analysis projects. In its current version, the PIA demonstrator is implemented on a front-end in a virtual machine. By adding an additional back-end, the progress of a project, attached files, comments, etc., can be saved and loaded properly. Furthermore, a direct connection to a database is conceivable. Implementing PIA in Angular was a time-efficient way to demonstrate its benefits. However, users can decide if they want to apply the concept in a different framework. Furthermore, the modules can be switched or customized to the specific needs of the users due to the open-source nature of this contribution and the PIA concept in general. The authors will further develop their concept in future research and test it on other use cases. Current development focuses on the integration of ontology’s, respectively machine-readable metadata in M1, the generalization of the checklist in M2, and improvements regarding the usability for inexperienced users in SMEs and, in M3, the integration of a data pipeline to evaluate the data quality as well as the usage of algorithms that consider measurement uncertainty.
A Code sample
1 const Station = [
2     {
3         id: '1',
4         title: 'Station 1',
5         img: "path/station_1/picture_station_1.jpg",
6         process_1: 'Process XY',
7         resource_1:[
8             {id: '1',
9             name: 'Robot XY',
10             technicalName: 'process 1 technical name',
11             img:"path/station_1/Process_1/Robot_XY/Robot_XY.jpg",
12             technicalData:"path/station_1/Process_1/Robot_XY/DataSheets/Robot_technical_details.pdf",
13             manual:"path/station_1/Process_1/Robot_XY/DataSheets/DataSheets/Robot_manual.pdf",
14             technicalDrawing:"path/station_1/Process_1/Robot_XY/DataSheets/Robot_technical_drawing.pdf"
15             }]
16     }]
Listing 2: Sample code for a station.
Data availability
This publication uses no data.
Software availability
The concept demonstrator can be found on GitHub: https://github.com/ZeMA-gGmbH/-PIA
5 Acknowledgements
This work was funded by the European Regional Development Fund (ERDF) in the framework of the research projects within the framework of the research projects “Messtechnisch gestützte Montage” and “iTecPro – Erforschung und Entwicklung von innovativen Prozessen und Technologien für die Produktion der Zukunft”. Future development is carried out in the project “NFDI4Ing – the National Research Data Infrastructure for Engineering Sciences”, funded by the Deutsche Forschungsgemeinschaft (DFG, German Research Foundation) – 442146713.
Furthermore, the authors thank Anne Blum and Dr.-Ing. Leonie Mende for their profound input during conceptualization and the Mittelstand 4.0-Kompetenzzentrum Saarbrücken for the deployment of a use case.
6 Roles and contributions
Christopher Schnur: Conceptualization, Writing & original draft
Tanja Dorst: Conceptualization, review & editing
Kapil Deshmukh: Programming & implementation
Sarah Zimmer: Conceptualization
Philipp Litzenburger: Conceptualization
Tizian Schneider: Methology & review
Lennard Margies: Coordination
Rainer Müller: Concept & Coordination
Andreas Schütze: Coordination, Concept & review
References
[1] M. Bauer, C. van Dinther, and D. Kiefer, “Machine learning in sme: An empirical study on enablers and success factors,” in AMCIS 2020 Proceedings, 2020.
[2] M. D. Wilkinson, M. Dumontier, I. J. Aalbersberg, et al., “The FAIR Guiding Principles for scientific data management and stewardship,” Scientific Data, vol. 3, no. 1, p. 160 018, 2016. DOI: http://doi.org/10.1038/sdata.2016.18.
[3] C. Schnur, S. Klein, A. Blum, A. Schütze, and T. Schneider, “Steigerung der Datenqualität in der Montage,” wt Werkstattstechnik online, vol. 112, pp. 783–787, Dec. 2022. DOI: http://doi.org/10.37544/1436-4980-2022-11-12-57.
[4] C. Schnur, S. Klein, and A. Blum, Checkliste – Mess- und Datenplanung für das maschinelle Lernen in der Montage, version 7, Aug. 2022. DOI: http://doi.org/10.5281/zenodo.6943476.
[5] C. Schnur, S. Klein, and A. Blum, Checklist – Measurement and data planning for machine learning in assembly, version 7, Jan. 2023. DOI: http://doi.org/10.5281/zenodo.7556876.
[6] T. Dorst, Y. Robin, T. Schneider, and A. Schütze, “Automated ML Toolbox for Cyclic Sensor Data,” in MSMM 2021 - Mathematical and Statistical Methods for Metrology, (Online, May 31–Jun. 1, 2021), 2021, pp. 149–150. [Online]. Available: http://www.msmm2021.polito.it/content/download/245/1127/file/MSMM2021_Booklet_c.pdf (visited on 01/24/2023).
[7] T. Schneider, N. Helwig, and A. Schütze, “Industrial condition monitoring with smart sensors using automated feature extraction and selection,” Measurement Science and Technology, vol. 29, no. 9, 2018. DOI: http://doi.org/10.1088/1361-6501/aad1d4.
[8] T. Schneider, N. Helwig, and A. Schütze, “Automatic feature extraction and selection for classification of cyclical time series data,” tm - Technisches Messen, vol. 84, no. 3, pp. 198–206, 2017. DOI: http://doi.org/10.1515/teme-2016-0072.
[9] V. Gudivada, A. Apon, and J. Ding, “Data Quality Considerations for Big Data and Machine Learning: Going Beyond Data Cleaning and Transformations,” International Journal on Advances in Software, vol. 10, pp. 1–20, Jul. 2017.
[10] S. Wang and R. A. Noe, “Knowledge sharing: A review and directions for future research,” Human Resource Management Review, vol. 20, pp. 115–131, 2010. DOI: http://doi.org/10.1016/j.hrmr.2009.10.001.
[11] A. Majchrzak, C. Wagner, and D. Yates, “Corporate Wiki Users: Results of a Survey,” in Proceedings of the 2006 International Symposium on Wikis, (Odense, Denmark, Aug. 21–23, 2006), New York, NY, USA: Association for Computing Machinery, 2006, pp. 99–104. DOI: http://doi.org/10.1145/1149453.1149472.
[12] InfluxData, Influxdb. it’s about time. 2013. [Online]. Available: https://www.influxdata.com/influxdb/.
[13] K. Banker, MongoDB in Action. USA: Manning Publications Co., 2011, ISBN: 1935182870.
[14] S. F. Rowe and S. Sikes, “Lessons learned: Taking it to the next level,” in PMI® Global Congress, (Seattle, WA, USA, Oct. 21–24, 2006), 2006.
[15] US Department of Energy, The DOE Corporate Lessons Learned Program, DOE-STD-7501-99, Dec. 1999. [Online]. Available: https://www.standards.doe.gov/standards-documents/7000/7501-astd-1999/@@images/file (visited on 01/24/2023).
[16] M. Q. Patton, “Evaluation, Knowledge Management, Best Practices, and High Quality Lessons Learned,” American Journal of Evaluation, vol. 22, no. 3, pp. 329–336, Sep. 2001. DOI: http://doi.org/10.1177/109821400102200307.
[17] J. Han, J. Pei, and H. Tong, Data mining: concepts and techniques. Morgan kaufmann, 2022.
[18] P. Chapman, J. Clinton, R. Kerber, et al., CRISP-DM 1.0: Step-by-step data mining guide, 2000. [Online]. Available: https://www.kde.cs.uni-kassel.de/wp-content/uploads/lehre/ws2012-13/kdd/files/CRISPWP-0800.pdf (visited on 01/24/2023).
[19] K. L. Sainani, “A checklist for analyzing data,” PMR, vol. 10, no. 9, pp. 963–965, 2018, ISSN: 1934-1482. DOI: http://doi.org/10.1016/j.pmrj.2018.07.015. [Online]. Available: https://www.sciencedirect.com/science/article/pii/S1934148218304258.
[20] S. Kangralkar, Analytical Checklist — A Data Scientist’ Guide for Data Analysis, 2021. [Online]. Available: https://medium.com/swlh/analytical-checklist-a-datascientist-guide-for-data-analysis-972ed3ff1d59 (visited on 08/11/2023).
[21] T. pandas development team, Pandas-dev/pandas: Pandas, version v2.0.3, If you use this software, please cite it as below., Jun. 2023. DOI: http://doi.org/10.5281/zenodo.8092754. [Online]. Available: https://doi.org/10.5281/zenodo.8092754.
[22] Creating machine learning models in power bi, Accessed: 2023-08-10, 2019. [Online]. Available: https://powerbi.microsoft.com/de-de/blog/creating-machine-learning-models-in-power-bi/.
[23] T. M. Inc., Statistics and machine learning toolbox version: 12.5 (r2023a), Natick, Massachusetts, United States, 2023. [Online]. Available: https://www.mathworks.com.
[24] M. R. Berthold, N. Cebron, F. Dill, et al., “Knime - the konstanz information miner: Version 2.0 and beyond,” SIGKDD Explor. Newsl., vol. 11, no. 1, pp. 26–31, 2009. DOI: http://doi.org/10.1145/1656274.1656280.
[25] R. T. Olszewski, “Generalized feature extraction for structural pattern recognition in time-series data,” Ph.D. dissertation, Carnegie Mellon University, 2001, ISBN: 978-0-493-53871-6.
[26] S. Wold, K. Esbensen, and P. Geladi, “Principal component analysis,” Chemometrics and Intelligent Laboratory Systems, vol. 2, no. 1-3, pp. 37–52, Aug. 1987. DOI: http://doi.org/10.1016/0169-7439(87)80084-9.
[27] F. Mörchen, “Time series feature extraction for data mining using DWT and DFT,” Department of Mathematics and Computer Science, University of Marburg, Germany -Technical Report, vol. 33, 2003. [Online]. Available: https://www.mybytes.de/papers/moerchen03time.pdf (visited on 01/24/2023).
[28] I. Daubechies, Ten Lectures on Wavelets. Society for Industrial and Applied Mathematics, 1992. DOI: http://doi.org/10.1137/1.9781611970104.
[29] A. Papoulis and S. U. Pillai, Probability, random variables, and stochastic processes, 4th ed. Boston: McGraw-Hill, 2002, ISBN: 978-0-07-366011-0.
[30] I. Guyon and A. Elisseeff, “An introduction to variable and feature selection,” Journal of Machine Learning Research, vol. 3, pp. 1157–1182, Mar. 2003.
[31] A. Rakotomamonjy, “Variable selection using svm-based criteria,” Journal of Machine Learning Research, vol. 3, pp. 1357–1370, Mar. 2003. DOI: http://doi.org/10.1162/153244303322753706.
[32] M. Robnik-Šikonja and I. Kononenko, “Theoretical and Empirical Analysis of ReliefF and RReliefF,” Machine Learning, vol. 53, no. 1, pp. 23–69, Oct. 2003. DOI: http://doi.org/10.1023/A:1025667309714.
[33] I. Kononenko and S. J. Hong, “Attribute selection for modelling,” Future Generation Computer Systems, vol. 13, no. 2-3, pp. 181–195, Nov. 1997, ISSN: 0167739X. DOI: http://doi.org/10.1016/S0167-739X(97)81974-7.
[34] J. Benesty, J. Chen, Y. Huang, and I. Cohen, “Pearson correlation coefficient,” in Noise Reduction in Speech Processing. Berlin, Heidelberg: Springer, 2009, pp. 1–4. DOI: http://doi.org/10.1007/978-3-642-00296-0_5.
[35] R. O. Duda, P. E. Hart, and D. G. Stork, Pattern classification, 2nd ed. New York: John Wiley & Sons, 2001, ISBN: 978-0-471-05669-0.
[36] P. Goodarzi, A. Schütze, and T. Schneider, tm - Technisches Messen, vol. 89, no. 4, pp. 224–239, 2022. DOI: http://doi.org/10.1515/teme-2021-0129. [Online]. Available: https://doi.org/10.1515/teme-2021-0129.
[37] T. Schneider, N. Helwig, and A. Schütze, “Automatic feature extraction and selection for condition monitoring and related datasets,” in 2018 IEEE International Instrumentation and Measurement Technology Conference (I2MTC), 2018, pp. 1–6. DOI: http://doi.org/10.1109/I2MTC.2018.8409763.
[38] R. Kohavi, “A study of cross-validation and bootstrap for accuracy estimation and model selection,” in Proceedings of the 14th International Joint Conference on Artificial Intelligence- Volume 2, (Montreal, Quebec, Canada, Aug. 20–25, 1995), ser. IJCAI’95, San Francisco, CA, USA: Morgan Kaufmann Publishers Inc., 1995, pp. 1137–1143, ISBN: 978-1-55860-363-9.
[39] T. Hastie, R. Tibshirani, and J. Friedman, The Elements of Statistical Learning: Data Mining, Inference, and Prediction, 2nd ed. New York, NY: Springer New York, 2009, ISBN: 978-0-387-84858-7. DOI: http://doi.org/10.1007/978-0-387-84858-7.
[40] T. Schneider, “Methoden der automatisierten merkmalextraktion und -selektion von sensorsignalen,” Masterarbeit, Universität des Saarlandes, Saarbrücken, Deutschland, 2015.
[41] D. Kuhn, R. Müller, L. Hörauf, M. Karkowski, and M. Holländer, “Wandlungsfähige Montagesysteme für die nachhaltige Produktion von morgen,” wt Werkstattstechnik online, vol. 110, no. 09, pp. 579–584, Feb. 2020. DOI: http://doi.org/10.37544/1436-4980-2020-09.


